Logs and Metrics via the OpenTelemetry Protocol
Logs and Metrics via the OpenTelemetry Protocol
In this guide, you run the aklivity/opentelemetry-demo and use Zilla to expose the Kafka topics as rest endpoints.
Specifically, you will:
Verify prerequisites to run this guide.
Install and run Zilla with the other OpenTelemetry demo components.
Verify the web store and Telemetry Demo is working.
Fetch Kafka Messages using Zilla.
Browse the Observability data created and sent by Zilla.
Prerequisites
Before proceeding, you should have Compose.
Detailed prerequisites
- A connection to the internet
- Docker version 1.13.0+ or later is installed and running
- Docker Compose v2.0.0+
- Container host resources: 2 CPU, 6GB memory
Install and run
Download the opentelemetry-demo repo. It will start Zilla and everything you need for this guide.
We have added a simple http proxy on the existing orders Kafka topic in the demo. In the zilla.yaml you can see the added otlp exporter and the demo environment variables used coming from the compose file.
---
name: ${{ env.OTEL_SERVICE_NAME }}
telemetry:
  attributes:
    service.name: ${{ env.OTEL_SERVICE_NAME }}
    service.version: ${{ env.ZILLA_VERSION }}

  # Desired metrics to track
  metrics:
    - http.active.requests
    - http.duration
    - http.request.size
    - http.response.size
    - stream.active.received
    - stream.active.sent
    - stream.opens.received
    - stream.opens.sent
    - stream.data.received
    - stream.data.sent
    - stream.errors.received
    - stream.errors.sent
    - stream.closes.received
    - stream.closes.sent

  # Open Telemetry exporter definition
  exporters:
    otel_exporter_otlp:
      type: otlp
      options:
        interval: 5
        signals:
          - metrics
          - logs
        endpoint:
          protocol: http
          location: ${{ env.OTEL_EXPORTER_OTLP_ENDPOINT }}

bindings:
  north_tcp_server:
    type: tcp
    kind: server
    options:
      host: 0.0.0.0
      port:
        - 7114
    routes:
      - when:
          - port: 7114
        exit: north_http_server
    telemetry:
      metrics:
        - stream.*
  north_http_server:
    type: http
    kind: server
    routes:
      - when:
          - headers:
              :scheme: http
              :authority: localhost:7114
        exit: north_http_kafka_mapping
    telemetry:
      metrics:
        - http.*
        - stream.*
  north_http_kafka_mapping:
    type: http-kafka
    kind: proxy
    routes:
      - when:
          - method: GET
            path: /{topic}
        exit: north_kafka_cache_client
        with:
          capability: fetch
          topic: ${params.topic}
          merge:
            content-type: application/json
    telemetry:
      metrics:
        - http.*
        - stream.*
  north_kafka_cache_client:
    type: kafka
    kind: cache_client
    exit: south_kafka_cache_server
    telemetry:
      metrics:
        - stream.*
  south_kafka_cache_server:
    type: kafka
    kind: cache_server
    exit: south_kafka_client
    telemetry:
      metrics:
        - stream.*
  south_kafka_client:
    type: kafka
    kind: client
    options:
      servers:
        - ${{ env.KAFKA_SERVICE_ADDR }}
    exit: south_tcp_client
    telemetry:
      metrics:
        - stream.*
  south_tcp_client:
    type: tcp
    kind: client
    telemetry:
      metrics:
- stream.*...
# Zilla
zillaproxy:
image: ghcr.io/aklivity/zilla:0.9.82
container_name: zilla-proxy
deploy:
resources:
limits:
memory: 500M
restart: unless-stopped
ports:
- "${ZILLA_PORT}:${ZILLA_PORT}"
environment:
- KAFKA_SERVICE_ADDR
- OTEL_EXPORTER_OTLP_ENDPOINT=http://${OTEL_COLLECTOR_HOST}:${OTEL_COLLECTOR_PORT_HTTP}
- OTEL_EXPORTER_OTLP_METRICS_TEMPORALITY_PREFERENCE
- OTEL_RESOURCE_ATTRIBUTES
- OTEL_SERVICE_NAME=zillaproxy
volumes:
- ./src/zillaproxy/zilla.yaml:/etc/zilla/zilla.yaml
command: start -v -e
healthcheck:
test: nc -z zilla ${ZILLA_PORT}
start_period: 10s
interval: 5s
timeout: 10s
retries: 10
depends_on:
otelcol:
condition: service_started
kafka:
condition: service_healthy
logging: *logging
...Run the Demo using Docker Compose from inside the demo directory:
docker compose up --force-recreate --remove-orphans --detachVerify the web store and Telemetry Demo
Once the images are built and containers are started you can access:
- Web store: http://localhost:8080/
- Grafana: http://localhost:8080/grafana/
- Grafana demo dashboard.
Fetch Kafka Messages
The running zillaproxy is configured to expose kafka topics passed in through the path
- Zilla Proxy: http://localhost:7114/{kafka_topic_name}
You can fetch all of the messages on the Kafka topic from a curl command.
curl http://localhost:7114/orders[
$ea598bca-0ed4-11ef-91e2-0242c0a80014$adb1a413-2ac6-4c8d-9aff-bd8955273889
USD� �ʵ�"4
United States*98109*leWA"
LS4PSXUNUM
USD9����*
2ZYFJ3GM2N
USD�����*
66VCHSJNUP
USD�����,
$ebed6139-0ed4-11ef-91e2-0242c0a80014$91b1d717-5aa8-4ee3-b401-c5942d7f9be5
USD����_"9
United States*95014* CupertinoCA"
L9ECAV7KIM
USD����*
66VCHSJNUP
USD�����]Create lots of request with a while loop:
while true; do; curl http://localhost:7114/orders; doneBrowse the Observability data
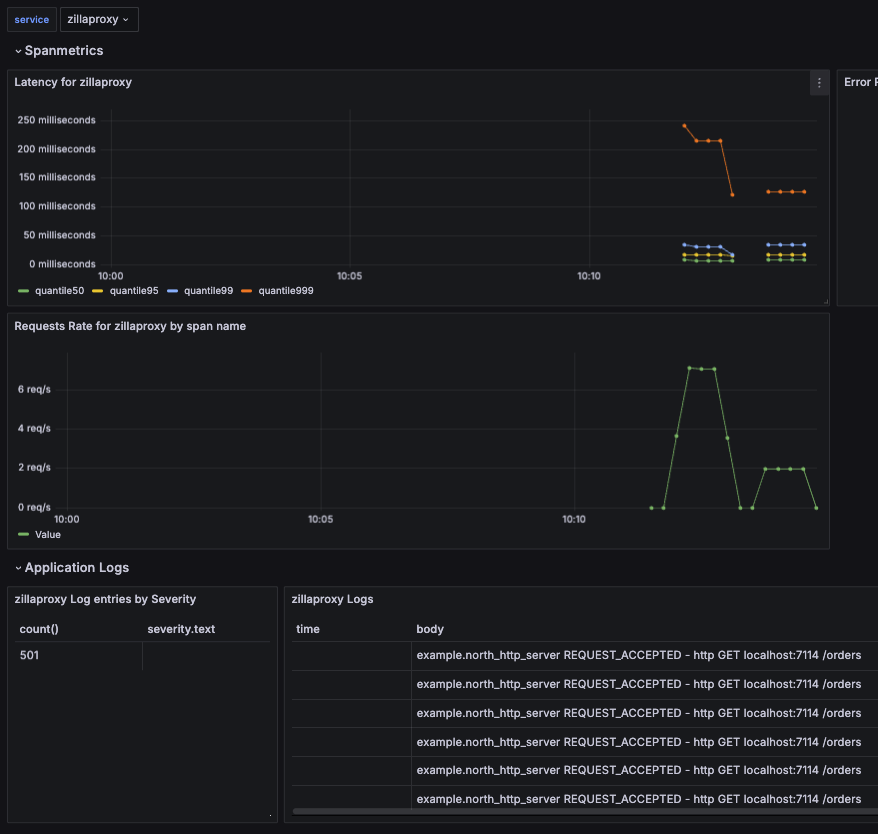
You can see the zillaproxy service logs and metrics in the OpenTelemetry Demo's Grafana demo dashboard.
The http.duration metrics are being used to track the Latency and Requests Rate sections of the dashboard. All of the event logs that zilla is exporting to stdout are in the Application Logs section.

Teardown
You have seen Zilla successfully export metrics to an otlp collector. You can teardown the demo using the below command.
docker compose down
